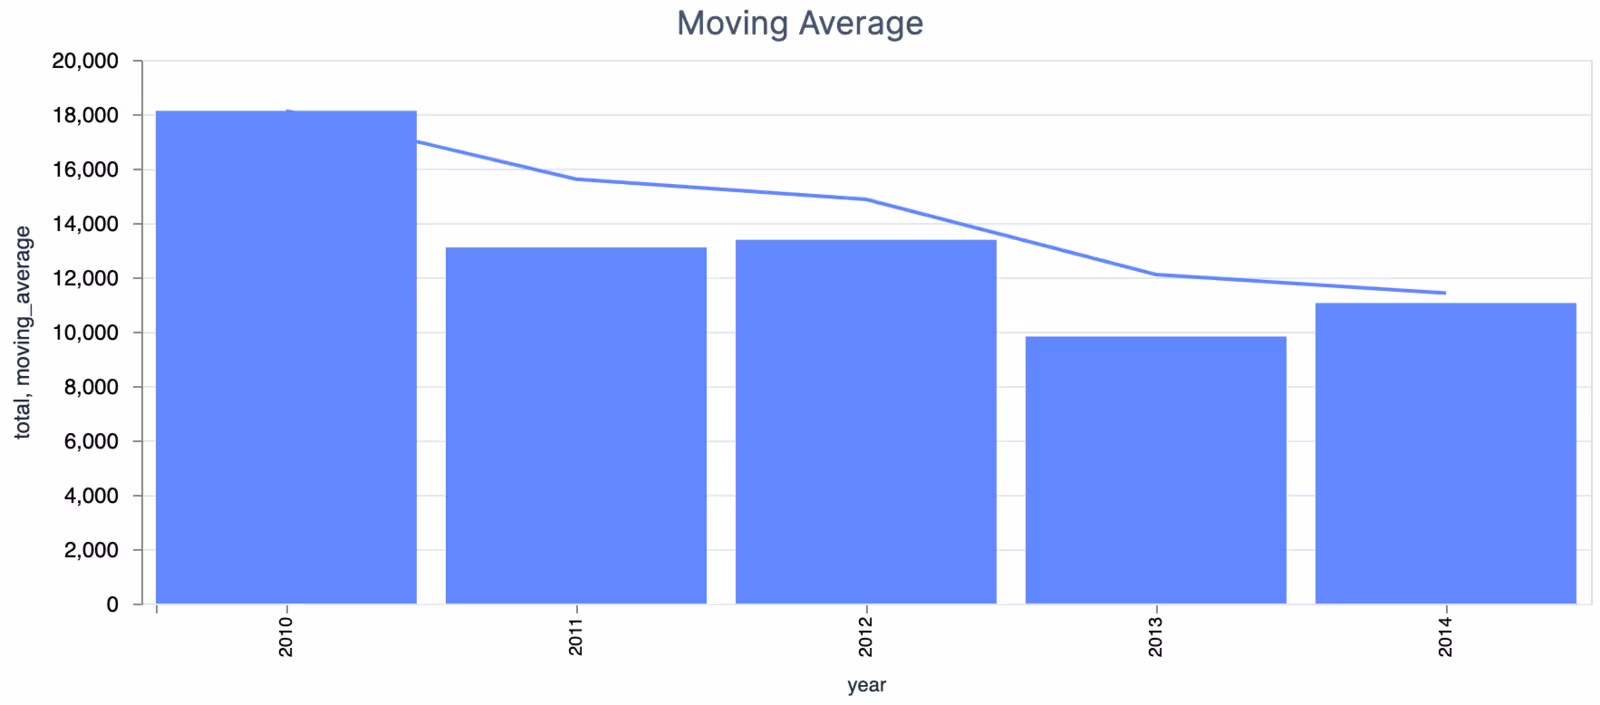
Displaying a Moving Average with Livebook
You will need Livebook installed. And then you can click the following link to see how to create a moving average graph in Livebook
![]()
Here is the main part of the work:
df =
  Explorer.Datasets.fossil_fuels()
  |> DataFrame.filter_with(&Series.equal(&1["country"], "DEMOCRATIC PEOPLE S REPUBLIC OF KOREA"))
  |> DataFrame.mutate_with(fn data ->
    moving_average =
      data[:total]
      |> Series.window_mean(3)

    %{moving_average: moving_average}
  end)
South Korea was the first country I found with a significant decrease in total fossil fuel production, which displays the moving average nicely.
And here is the final graph